Exhibit 99.2
[LOGO]

Exhibit 99.2
[LOGO]

Rigel Conference Call FIT Phase 3 Study in ITP October 20, 2016 5:00am PT / 8:00am ET

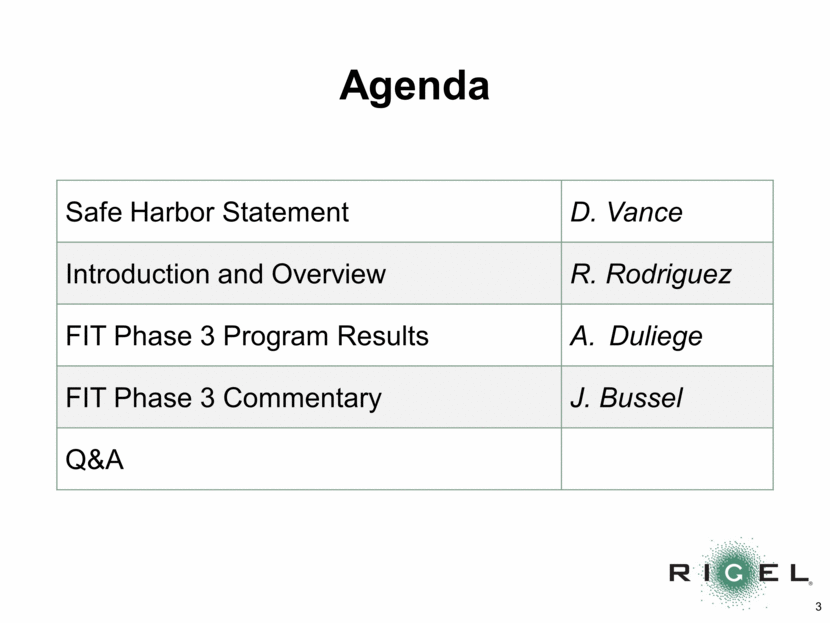
Agenda Safe Harbor Statement D. Vance Introduction and Overview R. Rodriguez FIT Phase 3 Program Results Duliege FIT Phase 3 Commentary J. Bussel Q&A
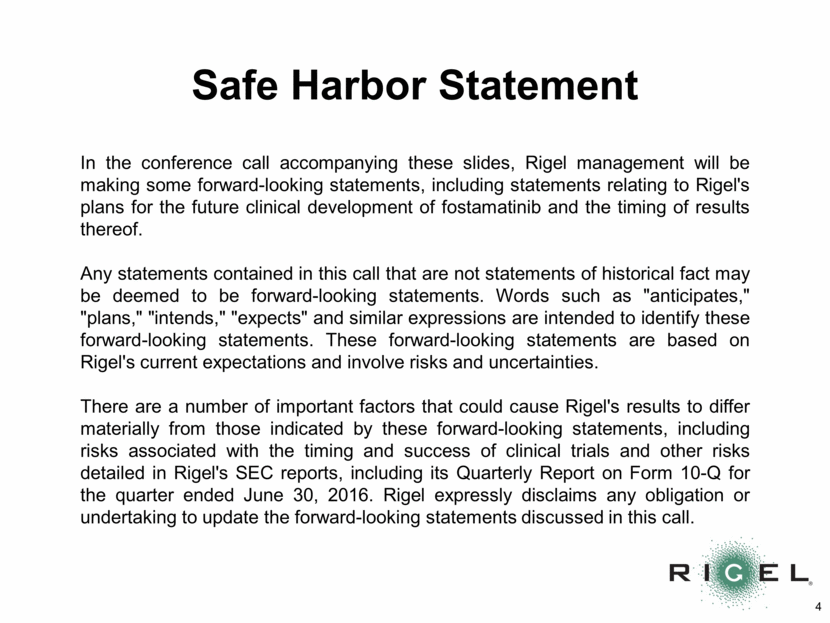
Safe Harbor Statement In the conference call accompanying these slides, Rigel management will be making some forward-looking statements, including statements relating to Rigel's plans for the future clinical development of fostamatinib and the timing of results thereof. Any statements contained in this call that are not statements of historical fact may be deemed to be forward-looking statements. Words such as "anticipates," "plans," "intends," "expects" and similar expressions are intended to identify these forward-looking statements. These forward-looking statements are based on Rigel's current expectations and involve risks and uncertainties. There are a number of important factors that could cause Rigel's results to differ materially from those indicated by these forward-looking statements, including risks associated with the timing and success of clinical trials and other risks detailed in Rigel's SEC reports, including its Quarterly Report on Form 10-Q for the quarter ended June 30, 2016. Rigel expressly disclaims any obligation or undertaking to update the forward-looking statements discussed in this call.
Introduction and Overview Raul Rodriguez President and Chief Executive Officer

Participants Rigel Senior Management: Raul Rodriguez – President and Chief Executive Officer Anne-Marie Duliege, MD – Executive Vice President and Chief Medical Officer Dolly Vance – Executive Vice President, Corporate Affairs and General Counsel Ryan Maynard – Executive Vice President and Chief Financial Officer Eldon Mayer – Executive Vice President and Chief Commercial Officer Esteban Masuda, PhD – Senior Vice President, Research Principal Investigator: James Bussel, MD – Professor of Pediatrics, Pediatrics in Obstetrics and Gynecology, and Pediatrics in Medicine at Weill Cornell Medical College

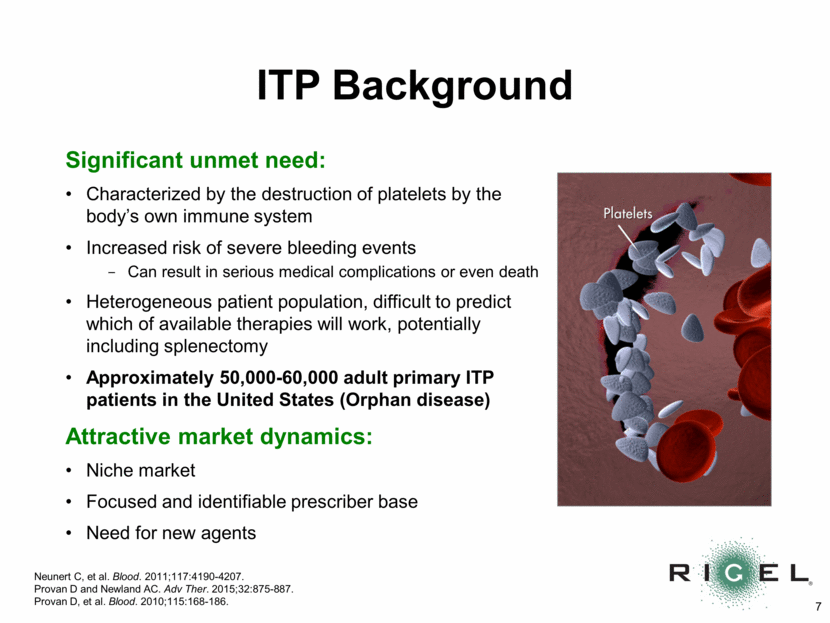
ITP Background Significant unmet need: Characterized by the destruction of platelets by the body’s own immune system Increased risk of severe bleeding events Can result in serious medical complications or even death Heterogeneous patient population, difficult to predict which of available therapies will work, potentially including splenectomy Approximately 50,000-60,000 adult primary ITP patients in the United States (Orphan disease) Attractive market dynamics: Niche market Focused and identifiable prescriber base Need for new agents Neunert C, et al. Blood. 2011;117:4190-4207. Provan D and Newland AC. Adv Ther. 2015;32:875-887. Provan D, et al. Blood. 2010;115:168-186.
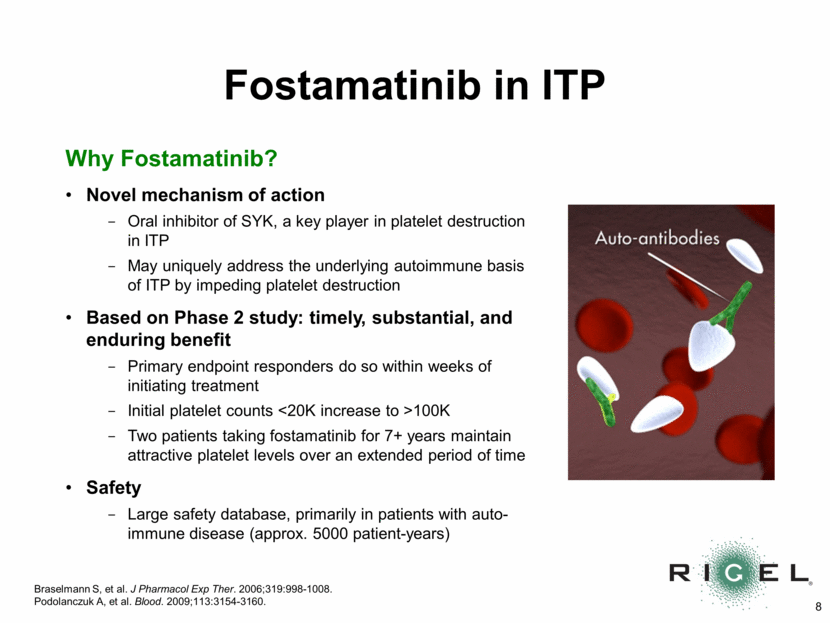
Why Fostamatinib? Novel mechanism of action Oral inhibitor of SYK, a key player in platelet destruction in ITP May uniquely address the underlying autoimmune basis of ITP by impeding platelet destruction Based on Phase 2 study: timely, substantial, and enduring benefit Primary endpoint responders do so within weeks of initiating treatment Initial platelet counts <20K increase to >100K Two patients taking fostamatinib for 7+ years maintain attractive platelet levels over an extended period of time Safety Large safety database, primarily in patients with auto-immune disease (approx. 5000 patient-years) Fostamatinib in ITP Braselmann S, et al. J Pharmacol Exp Ther. 2006;319:998-1008. Podolanczuk A, et al. Blood. 2009;113:3154-3160.
FIT Phase 3 Program Results Anne-Marie Duliege, MD Executive Vice President and Chief Medical Officer
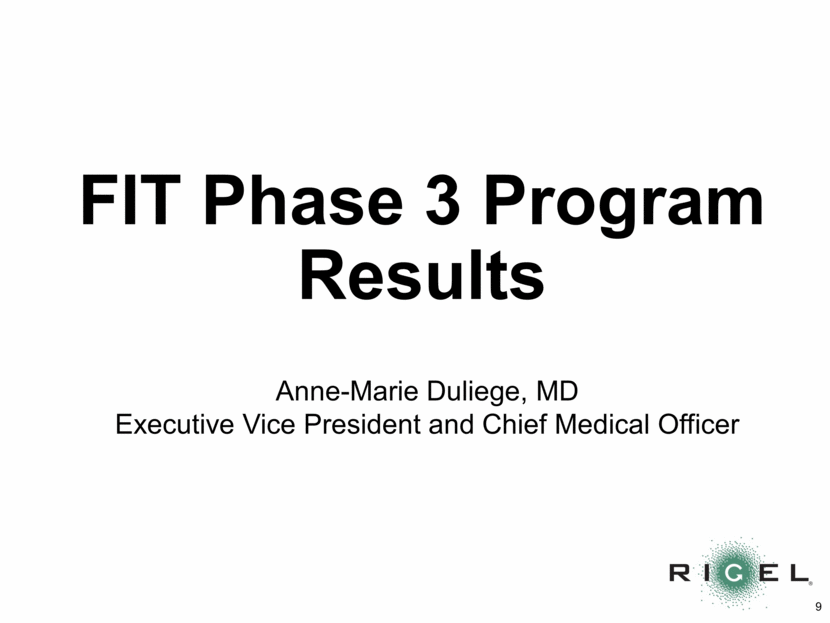
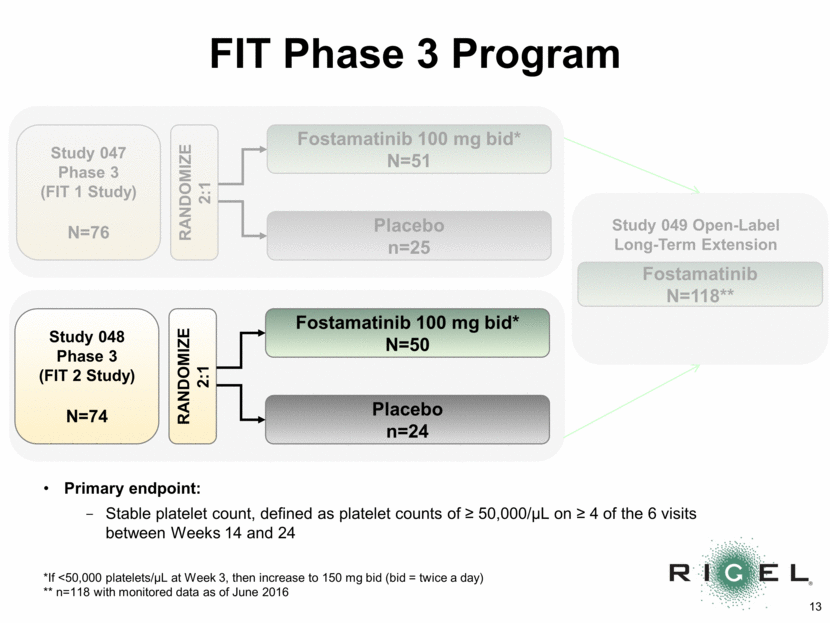
Study 049 Open-Label Long-Term Extension *If <50,000 platelets/L at Week 3, then increase to 150 mg bid (bid = twice a day) ** n=118 with monitored data as of June 2016 Study 048 Phase 3 (FIT 2 Study) N=74 Fostamatinib 100 mg bid* N=50 Placebo n=24 RANDOMIZE 2:1 Study 047 Phase 3 (FIT 1 Study) N=76 Fostamatinib 100 mg bid* N=51 Placebo n=25 RANDOMIZE 2:1 Primary endpoint: Stable platelet count, defined as platelet counts of > 50,000/L on > 4 of the 6 visits between Weeks 14 and 24 Fostamatinib N=118** FIT Phase 3 Program
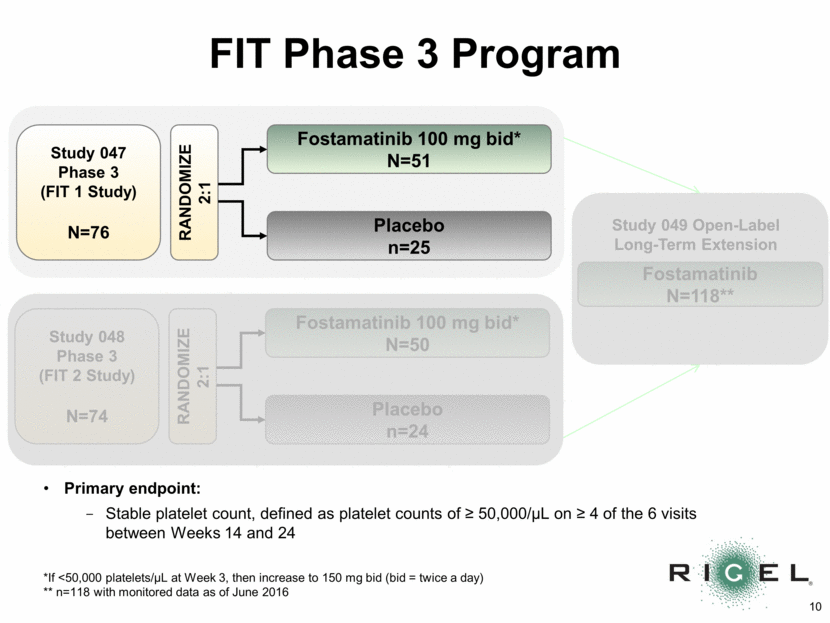
From August announcement: FIT 1 Phase 3 – Study 047: Primary Endpoint p=0.0261 n=9 *Stable platelet response (primary endpoint): platelet count of >50,000/L on > 4 of the last 6 visits between Week 14 and Week 24 9/51=18% n=0 18% 0% 0% 20% 40% 60% 80% 100% Fostamatinib (n=51) Placebo (n=25) Percent of Patients Stable Platelet Response* by Week 24
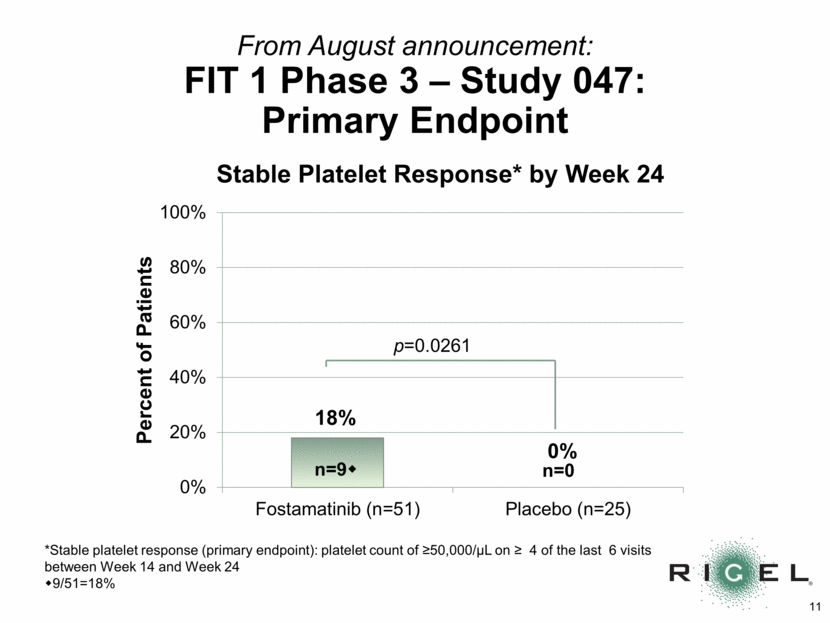
From August announcement: FIT 1 Phase 3 - Study 047: Adverse Events Number (n) and % of Patients with > one Adverse Event (AE) Fostamatinib N=51 Placebo N=25 n (%) N (%) Any AE 49 (96%)* 19 (76%) Serious AEs 8 (16%) 5 (20%) Treatment-related AEs 39 (77%) 7 (28%) Gastrointestinal complaints** 31 (61%) 5 (20%) - Nausea 15 (29%) 1 (4%) - Diarrhea 23 (45%) 4 (16%) Infection 17 (33%) 5 (20%) Hypertension during visit 18 (35%) 2 (8%) Transaminase elevation 11 (22%) 0 (0%) * AEs in the fostamatinib group were generally mild (68%) or moderate (29%) ** Nausea, vomiting, diarrhea, or abdominal pain
Study 049 Open-Label Long-Term Extension *If <50,000 platelets/L at Week 3, then increase to 150 mg bid (bid = twice a day) ** n=118 with monitored data as of June 2016 Study 048 Phase 3 (FIT 2 Study) N=74 Fostamatinib 100 mg bid* N=50 Placebo n=24 RANDOMIZE 2:1 Study 047 Phase 3 (FIT 1 Study) N=76 Fostamatinib 100 mg bid* N=51 Placebo n=25 RANDOMIZE 2:1 Primary endpoint: Stable platelet count, defined as platelet counts of > 50,000/L on > 4 of the 6 visits between Weeks 14 and 24 Fostamatinib N=118** FIT Phase 3 Program
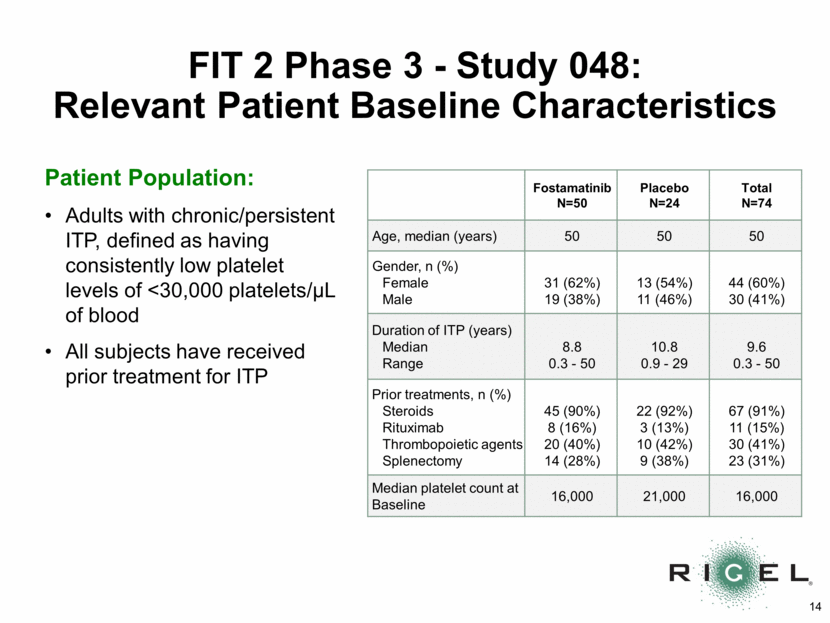
FIT 2 Phase 3 - Study 048: Relevant Patient Baseline Characteristics Patient Population: Adults with chronic/persistent ITP, defined as having consistently low platelet levels of <30,000 platelets/µL of blood All subjects have received prior treatment for ITP Fostamatinib N=50 Placebo N=24 Total N=74 Age, median (years) 50 50 50 Gender, n (%) Female Male 31 (62%) 19 (38%) 13 (54%) 11 (46%) 44 (60%) 30 (41%) Duration of ITP (years) Median Range 8.8 0.3 - 50 10.8 0.9 - 29 9.6 0.3 - 50 Prior treatments, n (%) Steroids Rituximab Thrombopoietic agents Splenectomy 45 (90%) 8 (16%) 20 (40%) 14 (28%) 22 (92%) 3 (13%) 10 (42%) 9 (38%) 67 (91%) 11 (15%) 30 (41%) 23 (31%) Median platelet count at Baseline 16,000 21,000 16,000
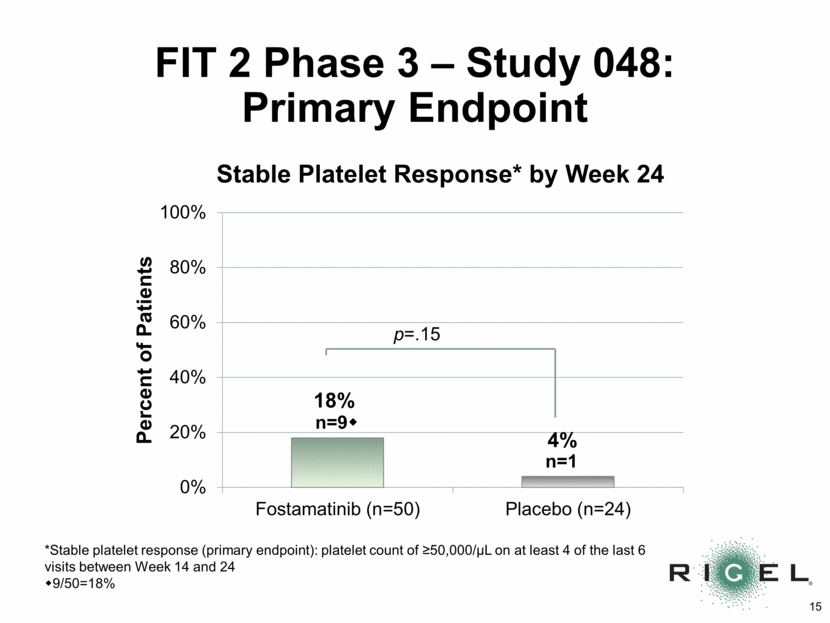
FIT 2 Phase 3 – Study 048: Primary Endpoint p=.15 n=9 *Stable platelet response (primary endpoint): platelet count of >50,000/L on at least 4 of the last 6 visits between Week 14 and 24 9/50=18% n=1 18% 4% 0% 20% 40% 60% 80% 100% Fostamatinib (n=50) Placebo (n=24) Percent of Patients Stable Platelet Response* by Week 24
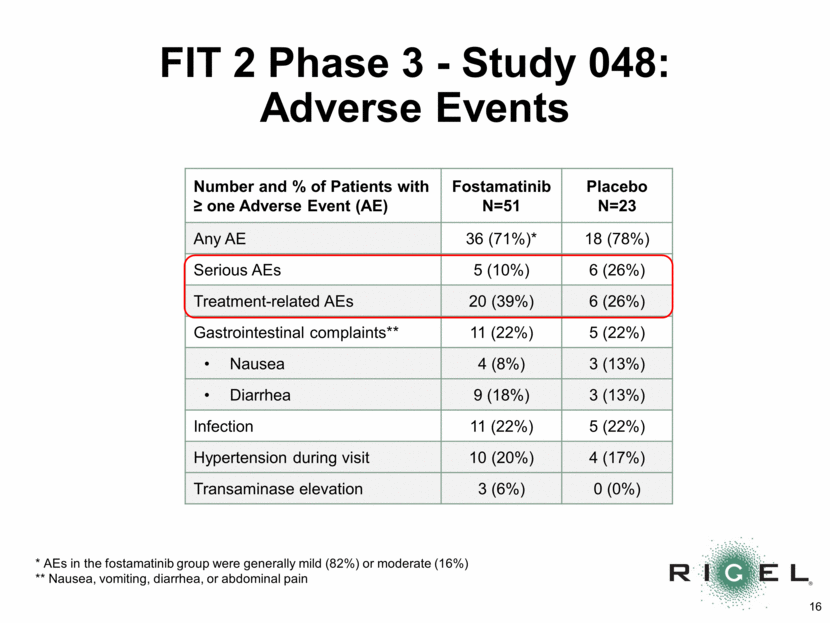
FIT 2 Phase 3 - Study 048: Adverse Events Number and % of Patients with > one Adverse Event (AE) Fostamatinib N=51 Placebo N=23 Any AE 36 (71%)* 18 (78%) Serious AEs 5 (10%) 6 (26%) Treatment-related AEs 20 (39%) 6 (26%) Gastrointestinal complaints** 11 (22%) 5 (22%) Nausea 4 (8%) 3 (13%) Diarrhea 9 (18%) 3 (13%) Infection 11 (22%) 5 (22%) Hypertension during visit 10 (20%) 4 (17%) Transaminase elevation 3 (6%) 0 (0%) * AEs in the fostamatinib group were generally mild (82%) or moderate (16%) ** Nausea, vomiting, diarrhea, or abdominal pain
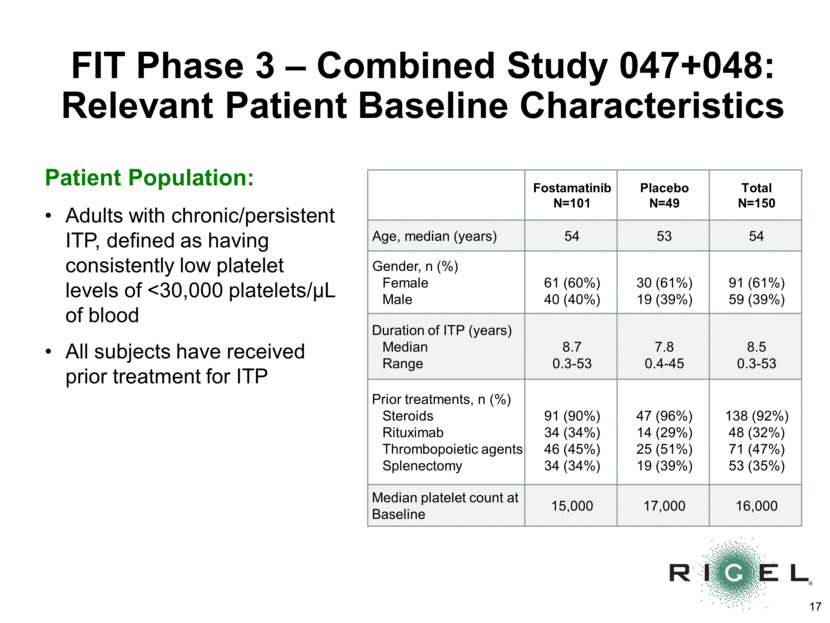
FIT Phase 3 – Combined Study 047+048: Relevant Patient Baseline Characteristics Patient Population: Adults with chronic/persistent ITP, defined as having consistently low platelet levels of <30,000 platelets/µL of blood All subjects have received prior treatment for ITP Fostamatinib N=101 Placebo N=49 Total N=150 Age, median (years) 54 53 54 Gender, n (%) Female Male 61 (60%) 40 (40%) 30 (61%) 19 (39%) 91 (61%) 59 (39%) Duration of ITP (years) Median Range 8.7 0.3-53 7.8 0.4-45 8.5 0.3-53 Prior treatments, n (%) Steroids Rituximab Thrombopoietic agents Splenectomy 91 (90%) 34 (34%) 46 (45%) 34 (34%) 47 (96%) 14 (29%) 25 (51%) 19 (39%) 138 (92%) 48 (32%) 71 (47%) 53 (35%) Median platelet count at Baseline 15,000 17,000 16,000
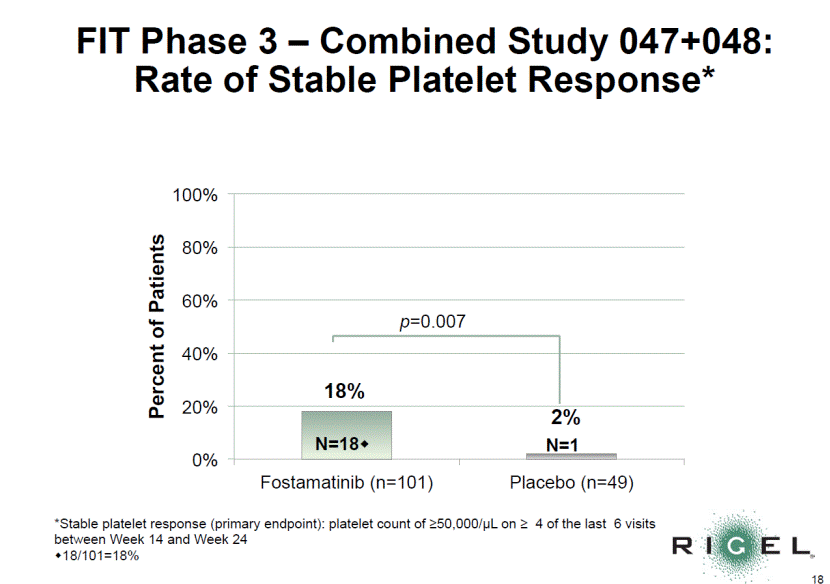
FIT Phase 3 – Combined Study 047+048: Rate of Stable platelet response* Endpoint p=0.007 N=18 *Stable platelet response (primary endpoint): platelet count of >50,000/L on > 4 of the last 6 visits between Week 14 and Week 24 18/101=18% N=1 18% 2% 0% 20% 40% 60% 80% 100% Fostamatinib (n=101) Placebo (n=49) Percent of Patients Stable Platelet Response* by Week 24
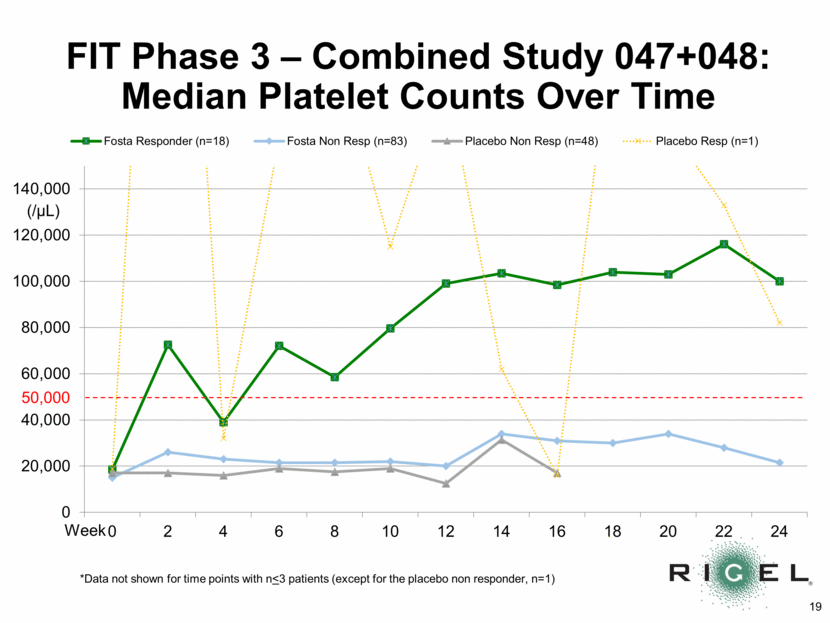
FIT Phase 3 – Combined Study 047+048: Median Platelet Counts Over Time Week (/L) *Data not shown for time points with n<3 patients (except for the placebo non responder, n=1) 50,000 0 20,000 40,000 60,000 80,000 100,000 120,000 140,000 0 2 4 6 8 10 12 14 16 18 20 22 24 Fosta Responder (n=18) Fosta Non Resp (n=83) Placebo Non Resp (n=48) Placebo Resp (n=1)
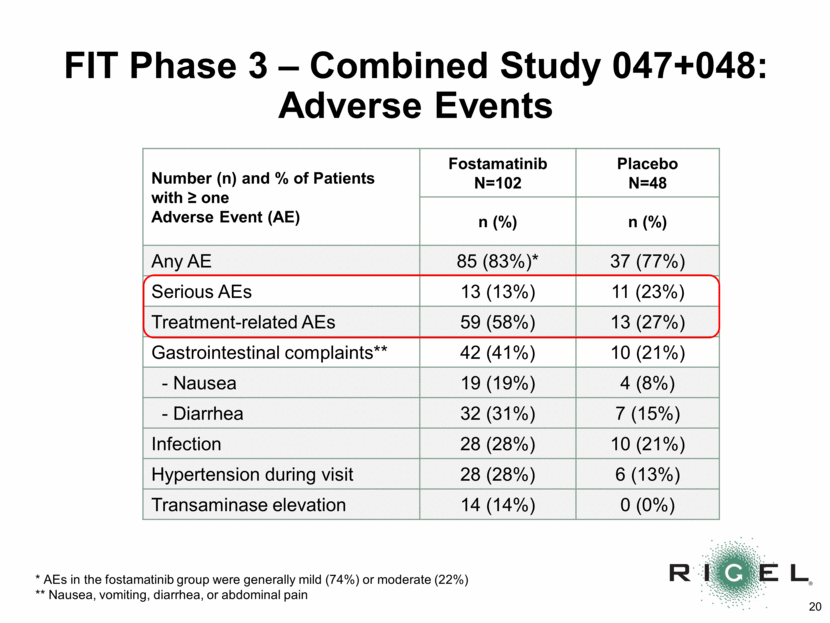
FIT Phase 3 – Combined Study 047+048: Adverse Events * AEs in the fostamatinib group were generally mild (74%) or moderate (22%) ** Nausea, vomiting, diarrhea, or abdominal pain Number (n) and % of Patients with > one Adverse Event (AE) Fostamatinib N=102 Placebo N=48 n (%) n (%) Any AE 85 (83%)* 37 (77%) Serious AEs 13 (13%) 11 (23%) Treatment-related AEs 59 (58%) 13 (27%) Gastrointestinal complaints** 42 (41%) 10 (21%) - Nausea 19 (19%) 4 (8%) - Diarrhea 32 (31%) 7 (15%) Infection 28 (28%) 10 (21%) Hypertension during visit 28 (28%) 6 (13%) Transaminase elevation 14 (14%) 0 (0%)
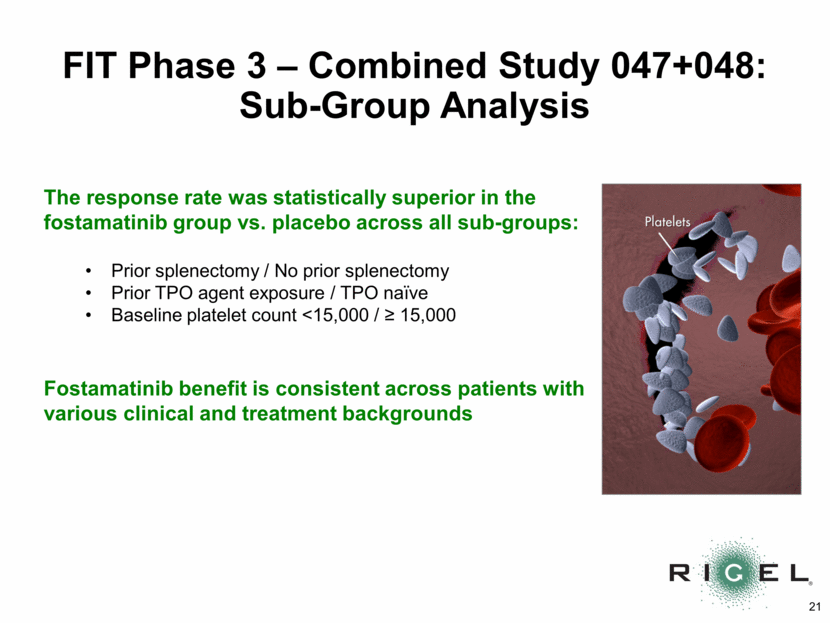
The response rate was statistically superior in the fostamatinib group vs. placebo across all sub-groups: Prior splenectomy / No prior splenectomy Prior TPO agent exposure / TPO naïve Baseline platelet count <15,000 / > 15,000 Fostamatinib benefit is consistent across patients with various clinical and treatment backgrounds FIT Phase 3 – Combined Study 047+048: Sub-Group Analysis
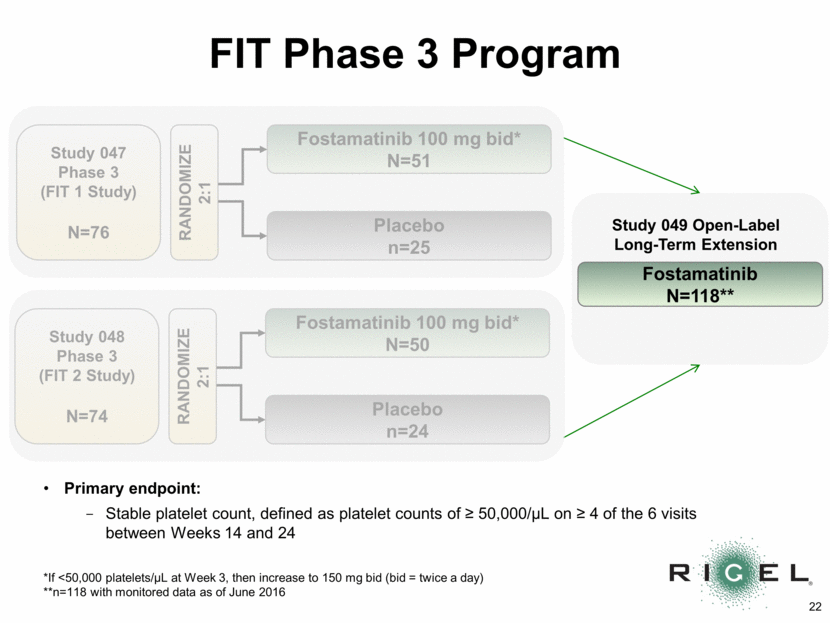
Study 049 Open-Label Long-Term Extension *If <50,000 platelets/L at Week 3, then increase to 150 mg bid (bid = twice a day) **n=118 with monitored data as of June 2016 Study 048 Phase 3 (FIT 2 Study) N=74 Fostamatinib 100 mg bid* N=50 Placebo n=24 RANDOMIZE 2:1 Study 047 Phase 3 (FIT 1 Study) N=76 Fostamatinib 100 mg bid* N=51 Placebo n=25 RANDOMIZE 2:1 Primary endpoint: Stable platelet count, defined as platelet counts of > 50,000/L on > 4 of the 6 visits between Weeks 14 and 24 Fostamatinib N=118** FIT Phase 3 Program
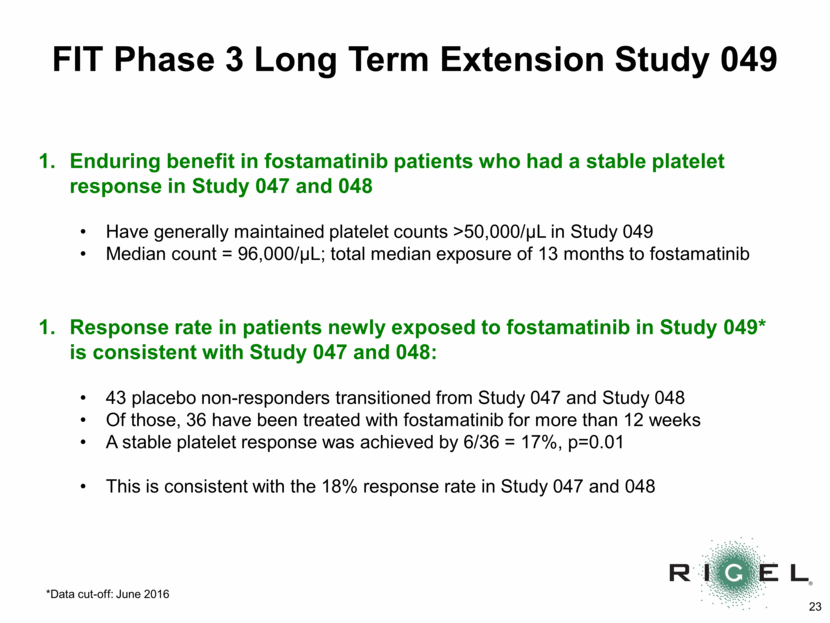
FIT Phase 3 Long Term Extension Study 049 Enduring benefit in fostamatinib patients who had a stable platelet response in Study 047 and 048 Have generally maintained platelet counts >50,000/L in Study 049 Median count = 96,000/L; total median exposure of 13 months to fostamatinib Response rate in patients newly exposed to fostamatinib in Study 049* is consistent with Study 047 and 048: 43 placebo non-responders transitioned from Study 047 and Study 048 Of those, 36 have been treated with fostamatinib for more than 12 weeks A stable platelet response was achieved by 6/36 = 17%, p=0.01 This is consistent with the 18% response rate in Study 047 and 048 *Data cut-off: June 2016
Fostamatinib FIT Phase 3 Program Commentary James Bussel, MD Principal Investigator
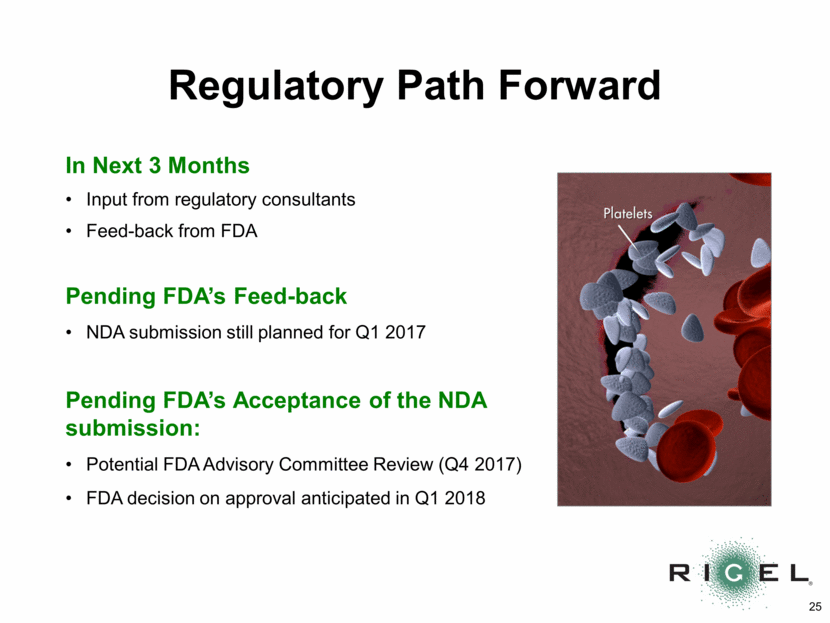
Regulatory Path Forward In Next 3 Months Input from regulatory consultants Feed-back from FDA Pending FDA’s Feed-back NDA submission still planned for Q1 2017 Pending FDA’s Acceptance of the NDA submission: Potential FDA Advisory Committee Review (Q4 2017) FDA decision on approval anticipated in Q1 2018
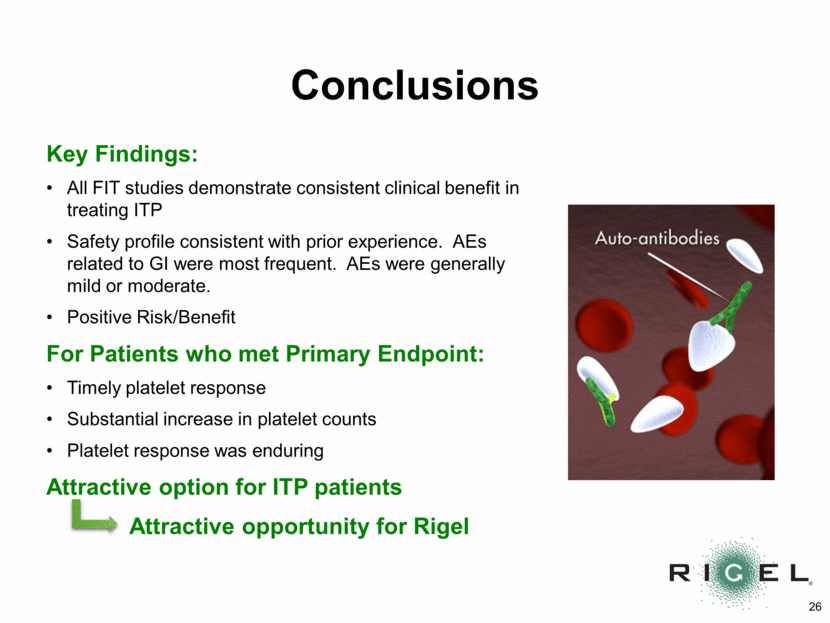
Conclusions Key Findings: All FIT studies demonstrate consistent clinical benefit in treating ITP Safety profile consistent with prior experience. AEs related to GI were most frequent. AEs were generally mild or moderate. Positive Risk/Benefit For Patients who met Primary Endpoint: Timely platelet response Substantial increase in platelet counts Platelet response was enduring Attractive option for ITP patients Attractive opportunity for Rigel
Q&A
